Contractor Reports & Analytics
Financial and project reports in seconds
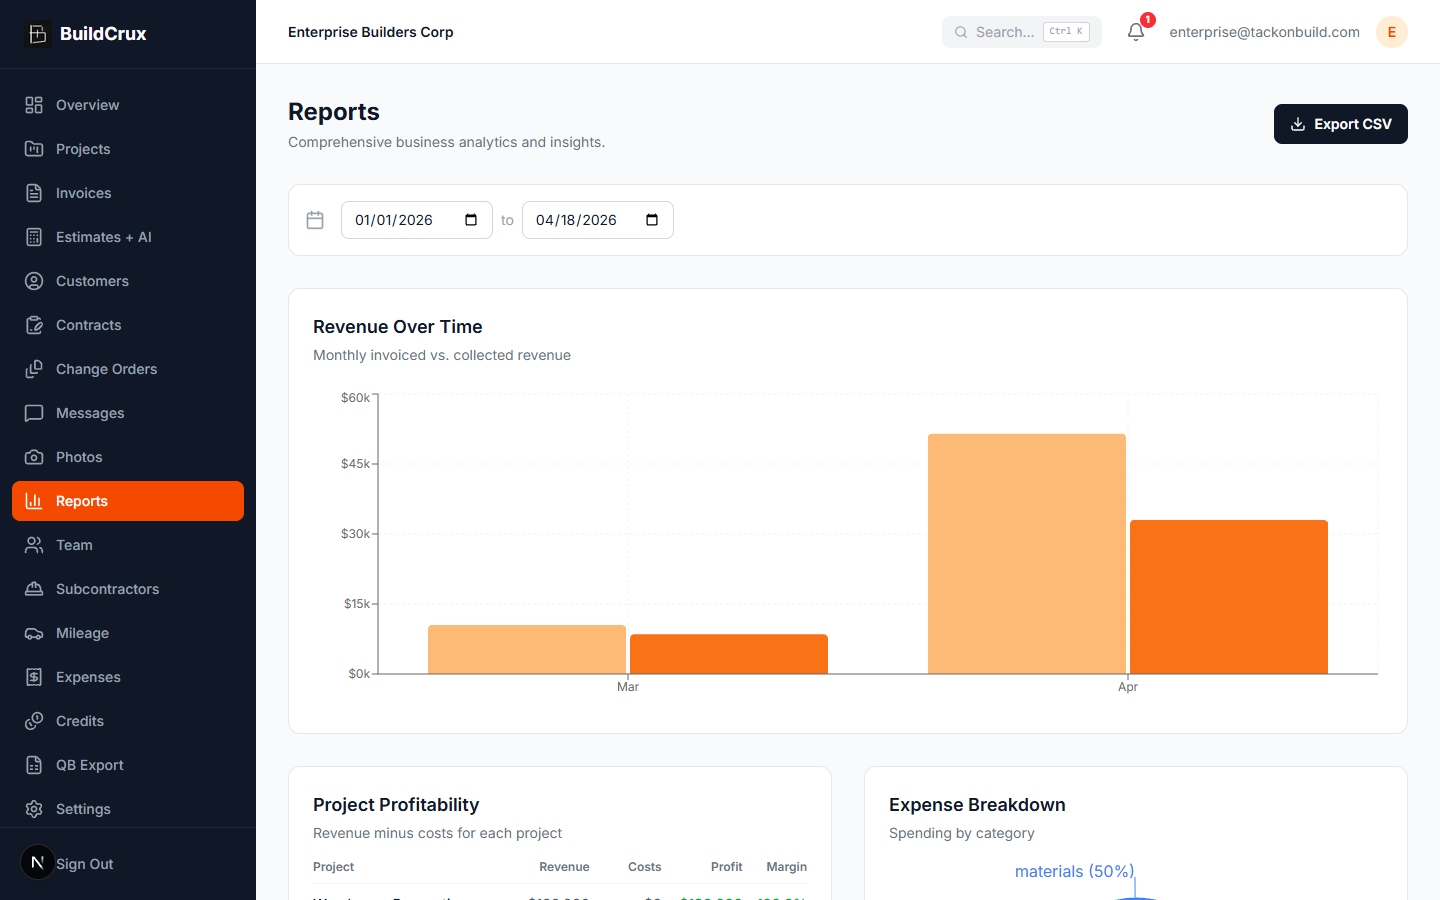
Generate financial summaries, project analytics, and expense breakdowns with a few clicks. BuildCrux compiles invoices, expenses, mileage, sub payments, and crew labor — the four cost categories that make profit honest — into clear, exportable reports so you are always prepared for tax season, client meetings, or business reviews. The Profitability table puts revenue against every cost category for each project; the Labor Summary card, powered by the Crew Time Clock, breaks down billable hours, total shifts, and labor cost across any date range.
What you get
Ready to streamline your business?
Try BuildCrux risk-free with our 30-day money-back guarantee — full refund within 30 days.
Related reading from the blog
Faizan Khan · 10 min read
Overhead and Profit in Construction, Explained
Overhead and profit is the number that decides whether a busy contractor is a profitable one. Most contractors guess at it. Here is what O&P actually covers, how to calculate your real overhead rate, and how to apply it to every bid and change order.
ReadFaizan Khan · 10 min read
Job Costing for Contractors: How to Know Real Profit on Every Job
Most contractors do not know which jobs make money and which ones quietly lose it. Job costing fixes that. Here is how to track every cost category against the job in real time, and read true margin while you can still do something about it.
Read